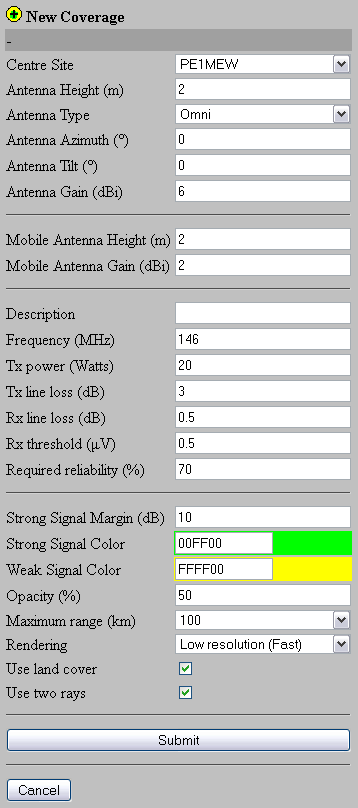
In this menu it is possible to specify the parameters for a Cartasian coverage plot. The plot displays the area wher the RX treshold is met together with a Strong Signal margin. Both plots have their own color specified.
 |
Calculate from and to other units ? Use the 'On-line RF calculator'. |
This bar presents messages as a responce to some actions.
Using the pull-down menu a site can be selected form the sites that are available in your database. Sites must be created using 'New Sites'.
Antenna height of site in meters above ground level.
Gain of the transmitter antenna in dBi.
Antenna deriection in degrees relative to true North Eastbound.
Gain of the mobile antenna in dBi.
Antenna height of the mobile antenna in meters above ground level.
Gain of the mobile antenna in dBi.
A short description of the link.
Frequency in MHz.
When a invalid frequency is entered a mesage is displayed after submitting the form. Invalid frequencys can accure when a frequency out side the allowed bands is entered. See 'Account types'
![]()
Transmitter power of the transmitter at Site-1 in Watt.
![]() Use the 'On-line RF calculator' to convert from dB to watt.
Use the 'On-line RF calculator' to convert from dB to watt.
Aditional loss of the cabling and (combining) filters between the transmitter and the antenna in dB.
Aditional loss of the cabling and (combining) filters between the antenna and the receiver in dB.
Receiver sensitivity of the receiver at the wanted minimum grade of service in μV.
![]() Use the 'On-line RF calculator' to convert from dBm or dBuV to μV.
Use the 'On-line RF calculator' to convert from dBm or dBuV to μV.
The required reliability of the RF link in %
The coverage produced by radio Mobile Online is a hybride of two polygons.
One is the area in wich the minimum signal to meet RX treshold is met.
This is the Weak Signal where: Rx treshold < x < Strong signal.
The Weak signal is calculated from: Rx treshold + Mobile antenna gain + Rx line loss.
The second area is the area in wich the signal is stronger than the Strong Signal: x > Strong signal.
The strong signal is calculated from: Weak signal + Strong signal margin.
The follwing imga shows a simplified coverage where all parameters are displayed:

This is a margin above the minimum signal to meet RX treshold in dB.
Select the HEX color code for the Strong signal color. The color is immediately displayed after a [TAB] to jump to the next field.
![]() Use the Color Picker to convert colors in to HEX-codes (
Use the Color Picker to convert colors in to HEX-codes (![]() In a pop-up window)
In a pop-up window)
Select the HEX color code for the Weak signal color. The color is immediately displayed after a [TAB] to jump to the next field.
![]() Use the Color Picker to convert colors in to HEX-codes (
Use the Color Picker to convert colors in to HEX-codes (![]() In a pop-up window)
In a pop-up window)
The transparency of the coverage polygons.
The maximum distance over which Radio Mobile Online will do pathloss calculations. The ranges are preset and can be choosen from by a pulldown menu.
The resolution of the prediction or bin-size of the calculation does affect teh detail of the presented image. A higher resolution will require more processing time. The resolution and so the calculation time can be selected here. A preset resolution is availabel form a dropbox.
Select to include Landcover in the propagation calculation or not.
Select the use of "Two Rays" for Line Of Sight calculations